  1
  2
  3
  4
  5
  6
  7
  8
  9
 10
 11
 12
 13
 14
 15
 16
 17
 18
 19
 20
 21
 22
 23
 24
 25
 26
 27
 28
 29
 30
 31
 32
 33
 34
 35
 36
 37
 38
 39
 40
 41
 42
 43
 44
 45
 46
 47
 48
 49
 50
 51
 52
 53
 54
 55
 56
 57
 58
 59
 60
 61
 62
 63
 64
 65
 66
 67
 68
 69
 70
 71
 72
 73
 74
 75
 76
 77
 78
 79
 80
 81
 82
 83
 84
 85
 86
 87
 88
 89
 90
 91
 92
 93
 94
 95
 96
 97
 98
 99
100
101
102
103
104
105
|
import sklearn.datasets
import torch
import numpy as np

np.random.seed(42)
torch.manual_seed(42)
X, y = sklearn.datasets.make_moons(200,noise=0.2)


import matplotlib.pyplot as plt

plt.scatter(X[:,0],X[:,1],s=40,c=y,cmap=plt.cm.binary)


X = torch.from_numpy(X).type(torch.FloatTensor)
y = torch.from_numpy(y).type(torch.LongTensor)


import torch.nn as nn
import torch.nn.functional as F

class Net(nn.Module):
    def __init__(self, activate="relu"):
        super(Net,self).__init__()
        h = 6
        self.fc1 = nn.Linear(2,h)
        self.fc2 = nn.Linear(h,2)
        self.relu = nn.ReLU()
        self.tanh = F.tanh
        self.activate = activate

    def forward(self,x):
        x = self.fc1(x)
        x = self.relu(x) if self.activate == "relu" else self.tanh(x)
        x = self.fc2(x)
        return x

    def predict(self,x):
        pred = F.softmax(self.forward(x))
        ans = []
        for t in pred:
            if t[0]>t[1]:
                ans.append(0)
            else:
                ans.append(1)
        return torch.tensor(ans)


#Initialize the model
model = Net()
#Define loss criterion
criterion = nn.CrossEntropyLoss()
#Define the optimizer
optimizer = torch.optim.Adam(model.parameters(), lr=0.01)

#Number of epochs
epochs = 50000
#List to store losses
losses = []
for i in range(epochs):
    #Precit the output for Given input
    y_pred = model.forward(X)
    #Compute Cross entropy loss
    loss = criterion(y_pred,y)
    #Add loss to the list
    losses.append(loss.item())
    #Clear the previous gradients
    optimizer.zero_grad()
    #Compute gradients
    loss.backward()
    #Adjust weights
    optimizer.step()


from sklearn.metrics import accuracy_score
print(accuracy_score(model.predict(X),y))


def predict(x):
    x = torch.from_numpy(x).type(torch.FloatTensor)
    ans = model.predict(x)
    return ans.numpy()


# Helper function to plot a decision boundary.
# If you don't fully understand this function don't worry, it just generates the contour plot below.
def plot_decision_boundary(pred_func,X,y):
    # Set min and max values and give it some padding
    x_min, x_max = X[:, 0].min() - .5, X[:, 0].max() + .5
    y_min, y_max = X[:, 1].min() - .5, X[:, 1].max() + .5
    h = 0.01
    # Generate a grid of points with distance h between them
    xx,yy=np.meshgrid(np.arange(x_min, x_max, h), np.arange(y_min, y_max, h))
    # Predict the function value for the whole gid
    Z = pred_func(np.c_[xx.ravel(), yy.ravel()])
    Z = Z.reshape(xx.shape)
    # Plot the contour and training examples
    plt.contourf(xx, yy, Z, cmap=plt.cm.Spectral)
    plt.scatter(X[:, 0], X[:, 1], c=y, cmap=plt.cm.binary)


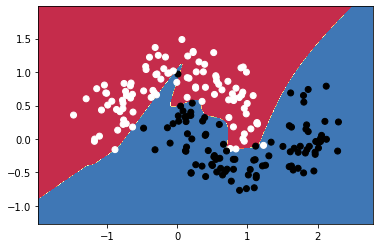
plot_decision_boundary(lambda x : predict(x) ,X.numpy(), y.numpy())
|


